
Published September 2026
Two reps can carry the exact same quota and the exact same pipeline value, and one of them will close 40% more revenue this quarter. The difference usually isn’t effort. It’s sales velocity — the single number that tells you how fast your pipeline actually turns into cash, and which of four specific levers is quietly holding your whole team back.
Sales velocity is a formula: how many opportunities you have, how often you win them, how much each one is worth, and how long they take to close. Most sales teams track those four things separately, in four different dashboards, and never multiply them together. That’s the mistake. Once you calculate the single number, you can see exactly which lever to pull first — and for most B2B teams, the fastest lever to move without hiring anyone new is the one this guide spends the most time on.
Key Takeaways
- Sales velocity = (Number of Opportunities × Win Rate × Average Deal Value) ÷ Sales Cycle Length — moving any single lever compounds the whole number.
- Gong Labs research found that reps who reply to prospects within 24 hours see 14% higher win rates and 11% shorter sales cycles than reps who don’t.
- Six in seven B2B executives say AI has already made their go-to-market motion faster, according to Highspot’s 2025 State of Sales Enablement Report.
- Sales cycle length is the easiest lever to compress without adding headcount — a faster, more personal first response removes days of stalled back-and-forth.
- Sendspark’s AI voice cloning lets a rep record one video and personalize it at scale, directly attacking the cycle-length denominator instead of just chasing more top-of-funnel leads.
What Is Sales Velocity (and What’s the Formula)?
Sales velocity measures how quickly your pipeline generates revenue, expressed as a single dollar figure per day, week, or month. The formula is Sales Velocity = (Number of Opportunities × Win Rate × Average Deal Value) ÷ Length of Sales Cycle. Unlike pipeline value or quota attainment, it forces all four variables to interact, so a big pipeline full of slow-moving, low-probability deals shows up for what it actually is.
Every other pipeline metric looks at one piece of the puzzle in isolation. Pipeline value tells you what’s sitting in the funnel, not how fast it’s moving. Win rate tells you how good your team is at closing, not how much they’re closing. Sales velocity multiplies the three “growth” variables — opportunities, win rate, and deal value — and then divides by the one “drag” variable, sales cycle length. That single division is what makes the formula useful: a slower cycle mathematically shrinks your revenue output even if every other number looks great.
“Every sales manager lives in fear their sales pipeline is a bunch of fluff…uncovering a sense of urgency and establishing sales velocity is important because it uncovers a slow-moving or, even worse, stagnant pipe.”
— Dan Tyre, Director of Sales, HubSpot
That framing matters more than the math itself. A rep can hit every activity target — calls made, demos booked, proposals sent — and still generate a fraction of the revenue their pipeline suggests, because the deals are creeping through the funnel instead of moving. Sales velocity is the metric that surfaces that creep before it shows up as a missed quarter.
The 4 Levers That Actually Move Sales Velocity
Sales velocity has exactly four levers, and each one has a different owner, a different ceiling, and a different cost to move: number of opportunities, win rate, average deal value, and sales cycle length. Three of them sit on top of the formula and increase velocity when they go up. The fourth — cycle length — sits on the bottom, so velocity only improves when that number goes down.
Most RevOps teams default to pulling the opportunity lever first, because “more pipeline” is the easiest thing to ask marketing for. It’s also usually the most expensive and slowest lever to move, since it depends on demand generation, headcount, and market conditions outside any single rep’s control — and the debate over whether warm or cold outbound fills that pipeline faster rarely changes the other three levers. The other three levers are almost entirely within your existing team’s reach.
| Lever | What Moves It | Typical Owner |
|---|---|---|
| Number of Opportunities | Lead quality and volume, targeting, MQL-to-SQL conversion | Marketing / SDRs |
| Win Rate | Qualification discipline, competitive positioning, proof of value | AEs / Sales Managers |
| Average Deal Value | Packaging, pricing strategy, expansion and upsell motion | Sales Leadership / AEs |
| Sales Cycle Length | Response speed, follow-up cadence, decision-maker clarity | AEs / Sales Ops |
Pro tip
Assign one named owner per lever before your next pipeline review. When a lever moves the wrong direction, “who owns cycle length” should have an obvious answer — not turn into a debate between sales and marketing.
How to Calculate Your Own Sales Velocity (Worked Example)
To calculate your sales velocity, multiply your number of open opportunities by your historical win rate and your average deal value, then divide by your average sales cycle length in days. Run the same calculation every month using a consistent time window, since comparing a 30-day snapshot to a 90-day snapshot will make the number meaningless.
Here’s a worked example using round numbers. Say your team is carrying 100 active opportunities this quarter, your historical win rate is 20%, and your average deal value is $10,000. Multiply those three: 100 × 0.20 × $10,000 = $200,000. That’s the revenue your current pipeline should generate once every deal in it plays out. Now divide by your average sales cycle length — say, 60 days: $200,000 ÷ 60 = $3,333 per day, or roughly $100,000 per month.
Now change one input. Shorten that 60-day cycle to 48 days — a 20% reduction — and hold everything else constant: $200,000 ÷ 48 = $4,167 per day, or about $125,000 per month. That’s a 25% increase in velocity from a single change to one lever, without adding a single new opportunity, improving win rate, or raising deal value. This is why cycle length gets its own section below: it’s the lever most teams ignore, and it’s usually the cheapest one to move. It’s also the lever most closely tied to forecast accuracy, since a pipeline full of deals stuck at the same stage for months quietly inflates your projected close dates.
Record One Video. AI Personalizes Thousands.
Sendspark is the AI video personalization platform for B2B sales. Record once, and AI voice cloning generates thousands of individually personalized videos with dynamic backgrounds and personalized thumbnails — each prospect hears their name, sees their website, in your voice. Sales teams see 2-3x more replies.
Get Started NowWhere AI Video Fits: Compressing the Cycle-Length Lever
Sales cycle length compresses fastest when the gap between a prospect’s action and your response shrinks, and that gap is exactly what AI-personalized video attacks. Sendspark lets a rep record one video, then uses AI voice cloning to personalize it at scale — each recipient hears their own name in the rep’s real voice, with a dynamic background showing their own company website, in the time it would normally take to draft one templated email.
Speed to first response is not a soft metric. Gong Labs found that in a third of surveyed deals, reps didn’t respond to a prospect email within 24 hours — and when they did respond inside that window, win rates were 14% higher and sales cycles were 11% shorter. Every day a deal sits waiting on a reply is a day added to the denominator of your velocity formula. A personalized video reply that takes minutes instead of the hours it takes to write a custom email directly shortens that wait.
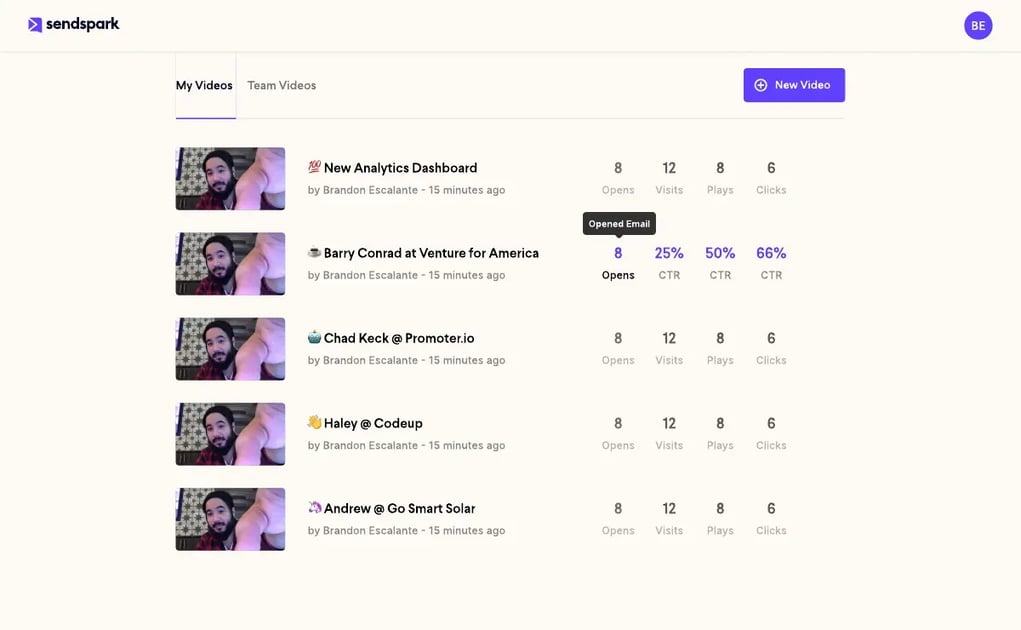
The cycle-length benefit doesn’t stop at the first touch. Sendspark’s Combined Videos feature lets a rep pair a short, freshly personalized intro with a longer reusable demo or proof-point video, so a follow-up after a demo goes out same-day instead of sitting in a to-do list — the same deal-progression use case that this whole lever depends on. Paired with video analytics that show exactly who opened, watched, and clicked — and sync back into your CRM so the whole team sees it — reps stop guessing which stalled deals need a nudge and which ones are genuinely dead. That’s a data-driven boost to the win-rate lever on top of the cycle-length gain.
Advanced strategy
Trigger a personalized video the moment a deal goes quiet — no reply for five business days, a demo with no follow-up booked, a proposal opened but not signed. A 30-second, AI-personalized nudge often unsticks a stalled deal faster than another templated check-in email.
The market is already moving this direction. Highspot’s 2025 State of Sales Enablement Report found that six in seven B2B executives say AI has already improved their go-to-market performance and led to faster sales cycles. Teams using AI-personalized video outreach report the effect directly: Sendspark customers see a 200-300% increase in email response rates and a 40-50% increase in meetings booked, with a 2:1 meeting-to-reply ratio compared to plain text email — all of it compressing the same cycle-length lever that’s the hardest one to move by hiring alone.
Common Mistakes That Tank Sales Velocity
The three most common sales velocity mistakes are inflating opportunity count with unqualified leads, chasing bigger average deal value at the cost of win rate, and treating cycle length as someone else’s problem to fix. Each one makes the top-line number look fine while quietly dragging the real formula in the wrong direction.
Padding the opportunity count is the easiest trap to fall into, because a full pipeline feels like progress. Unqualified leads inflate the numerator without ever converting, which drags down win rate and wastes rep hours that could go toward deals that actually close. A smaller pipeline of genuinely qualified opportunities almost always produces higher velocity than a bloated one full of tire-kickers, especially once you pair qualification discipline with sharper closing technique on the deals that remain.
Common mistake
Don’t chase a bigger average deal size by adding stakeholders, custom terms, or scope to every opportunity. It inflates one lever while quietly stretching cycle length and crushing win rate — a net loss to overall velocity, even though the deal-value number looks better in isolation.
The third mistake is the most expensive: assuming cycle length is fixed by “how B2B buying works” and therefore not worth managing. It isn’t fixed. Response speed, follow-up cadence, and how clearly a rep identifies the real decision-maker are all controllable inputs, and per the HubSpot and Salesforce guidance on the formula, cycle length is consistently the lever most teams under-invest in relative to how much it moves the final number.
Sales Velocity at a Glance
| Lever | Effect on Velocity | Fastest Tactic |
|---|---|---|
| Number of Opportunities | Higher = faster velocity | Tighten MQL-to-SQL qualification criteria |
| Win Rate | Higher = faster velocity | Use engagement data to prioritize warm deals |
| Average Deal Value | Higher = faster velocity | Sell to ideal-fit accounts, not the biggest logo |
| Sales Cycle Length | Lower = faster velocity | Personalized video replies within 24 hours |
Frequently Asked Questions
What is a good sales velocity?
There’s no universal benchmark, because it depends heavily on your industry, average deal size, and growth stage. What matters more than the absolute number is the trend: track it monthly using a consistent time window, and treat a steady increase as evidence your process is improving, not just your headcount.
How do you calculate sales velocity?
Multiply your number of open opportunities by your historical win rate and your average deal value, then divide the result by your average sales cycle length. Use the same time period every time you run the calculation, since mixing a 30-day snapshot with a 90-day one will make month-over-month comparisons meaningless.
What’s the difference between sales velocity and sales volume?
Sales volume counts how many units or deals you sold, while sales velocity measures how fast revenue is moving through your entire pipeline. A team can have high volume and low velocity if deals take months to close, or lower volume with high velocity if a lean pipeline converts fast and cheaply.
Which lever is easiest to improve first?
Sales cycle length is usually the fastest lever to move, because it’s controlled by your own team’s response speed and follow-up discipline rather than external demand generation or market conditions. Faster, more personal replies compress cycle length almost immediately, without requiring new headcount or pricing changes.
How does AI affect sales velocity?
AI mainly compresses the cycle-length lever by speeding up personalized outreach and follow-up that would otherwise take hours per prospect. Highspot’s 2025 research found six in seven B2B executives already say AI has sped up their go-to-market motion, largely by removing the manual bottleneck between “prospect took an action” and “rep responded.”
Can I improve sales velocity without adding headcount?
Yes — three of the four levers are process improvements, not hiring decisions. Tightening lead qualification, using engagement data to prioritize warm deals, and speeding up personalized follow-up with AI video all move the formula without adding a single new rep to the team.
Does the sales velocity formula work for subscription or renewal-based sales?
Yes, with one adjustment: swap average deal value for average contract value or lifetime value, and measure cycle length from first touch to signed renewal or expansion. The same four-lever logic applies whether you’re closing new logos or growing existing accounts.
Sources & References
- HubSpot — “Every sales manager lives in fear their sales pipeline is a bunch of fluff” and the sales velocity formula, attributed to Dan Tyre, Director of Sales (2026)
- Gong (via PRNewswire) — “When [reps] respond within 24 hours, win rates are 14% higher, and sales cycle lengths are 11% shorter” (2022)
- Highspot — “Six in seven B2B execs said AI has improved their GTM performance and led to faster sales cycles,” State of Sales Enablement Report (2025)
- Salesforce — Sales velocity formula and strategies for increasing win rate and shortening sales cycle (2026)
Record One Video. AI Personalizes Thousands.
Sendspark is the AI video personalization platform for B2B sales. Record once, and AI voice cloning generates thousands of individually personalized videos with dynamic backgrounds and personalized thumbnails — each prospect hears their name, sees their website, in your voice. Sales teams see 2-3x more replies.
Get Started NowRun the math on your own plan and team size before your next pipeline review — even a modest cycle-length reduction compounds into real revenue at scale. Sales velocity isn’t a vanity metric to report once a quarter — it’s a diagnostic you can run every week to find exactly where your revenue engine is losing time. Most teams have room on all four levers, but cycle length is where the fastest, cheapest gains are usually hiding. Start there, track the number monthly, and let the formula tell you where to focus next. For a deeper look at building the outreach motion that feeds this formula, see Sendspark’s comprehensive guide to video prospecting.